
Bkamprath/iStock via Getty Images
Introduction
The Weekly Breakout Forecast continues my doctoral research analysis on MDA breakout selections over more than 7 years. This subset of the different portfolios I regularly analyze has now reached 260 weeks of public selections as part of this ongoing live forward-testing research. The frequency of 10%+ returns in a week is averaging over 4x the broad market averages over the past 5+ years.
In 2017, the sample size began with 12 stocks, then 8 stocks in 2018, and at members’ request since 2020, I now generate only 4 selections each week. In addition 2 Dow 30 picks are provided, as well as a new active ETF portfolio that competes against a signal ETF model. Monthly Growth & Dividend MDA breakout stocks continue to beat the market each year as well. I offer 11 top models of short- and long-term value and momentum portfolios that have beaten the S&P 500 since my trading studies were made public:
- Value & Momentum Breakouts For 2022: 11 Models To Beat S&P 500
The cumulative average breakout returns for 2022 is up to +67.1% not using the gauge signal. Officially, for trading safety, there has only been one full week of a positive signal in 2022 with the worst start to the stock market since the 1939.
In a quick study of the MDA selections YTD, there are 52 picks in 20 weeks beating the S&P 500. 37 picks are beating the S&P 500 by over 10% and as high as 89.0% (RES), +113.3% (TDW), +27.1% (MNRL) and +45.7% (GNK) significantly beating the major indices YTD.
VMBreakouts.com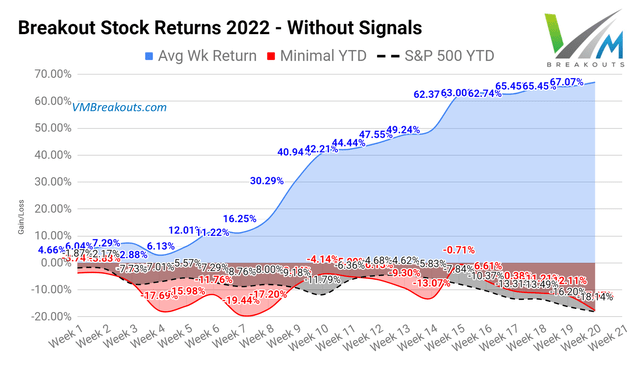
Additional background, measurements, and high frequency breakout records on the Weekly MDA Breakout model is here: Value And Momentum MDA Breakouts +70.5% In 52 Weeks: Final 2021 Year End Report Card
Returns from 21 Weeks of Positive Momentum Gauge signals in 2021
Last year there were only 21 positive trading weeks to achieve +70.5% returns. For 2022 the market has been even worse with only one official positive weekly signal in the past 24 weeks since the November topping signal.
VMBreakouts.com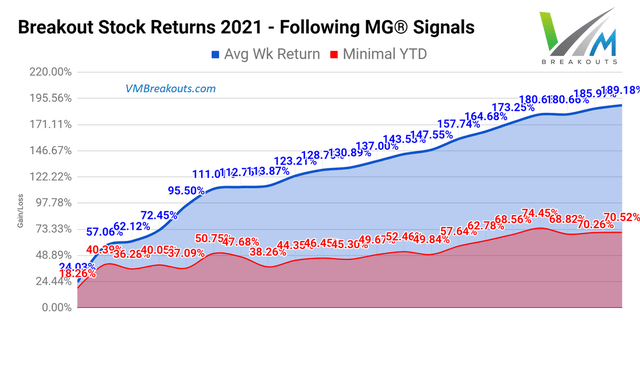
Momentum Gauge® trading signal: Negative conditions ahead of Week 21
Weekly return measurements into the 2nd quarter of 2022.
VMBreakouts.com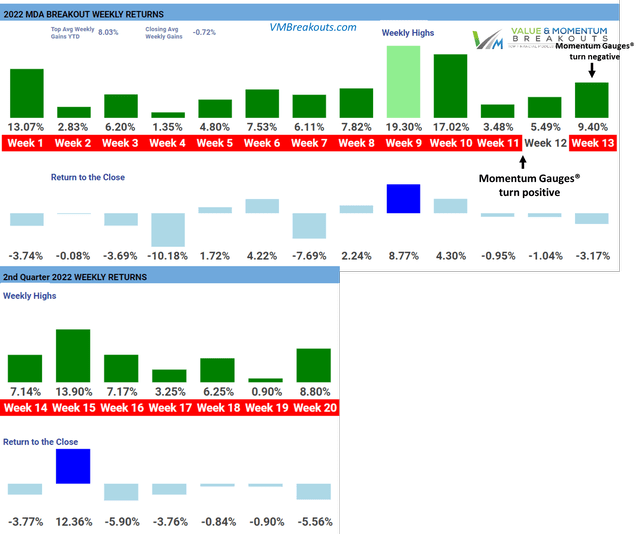
Red weekly color indicates negative Market Momentum Gauge signals. MDA breakout selections outperform when the market signal is positive and daily negative values are below 40 level.
Historical Performance Measurements
Historical MDA Breakout minimal buy/hold returns are at +70.5% YTD when trading only in the positive weeks consistent with the positive Momentum Gauges® signals. Remarkably, the frequency streak of 10% gainers within a 4- or 5-day trading week continues at highly statistically significant levels above 80% not counting frequent multiple 10%+ gainers in a single week.
Longer term many of these selections join the V&M Multibagger list now at 96 weekly picks with over 100%+ gains, 42 picks over 200%+, 17 picks over 500%+ and 9 picks with over 1000%+ gains since January 2019 such as:
- Intrepid Potash (IPI) +1,682.4%
- Houghton Mifflin Harcourt Company (HMHC) +1,413.8%
- Celsius Holdings (CELH) +1,150.4%
- Enphase Energy (ENPH) +1,116.6%
- Trillium Therapeutics (TRIL) +1008.7%
More than 200 stocks have gained over 10% in a 5-day trading week since this MDA testing began in 2017. A frequency comparison chart is at the end of this article. Readers are cautioned that these are highly volatile stocks that may not be appropriate for achieving your long-term investment goals: How to Achieve Optimal Asset Allocation.
2022 Breakout Portfolio Returns
The Momentum Gauge® conditions continue with highly negative warning signals with only one full week of positive conditions in week 12 of 2022 with minimum returns of -1.0% following the signals and avoiding the worst start to the US stock market since 1939.
The Breakout Picks are high volatility selections for high short-term gains, but with no selections below $2/share, under 100k average daily volume, or less than $100 million market cap. Prior returns are documented here:
- Value & Momentum MDA Breakouts +70.5% In 52 Weeks: Final 2021 Year End Report Card | Seeking Alpha Marketplace
2022 marks the worst start to the stock market since 1939 and the Momentum Gauge® MDA buy signals continue strongly negative ahead of next week. It is best to follow the signals and avoid momentum stocks until conditions turn positive.
VMBreakouts.com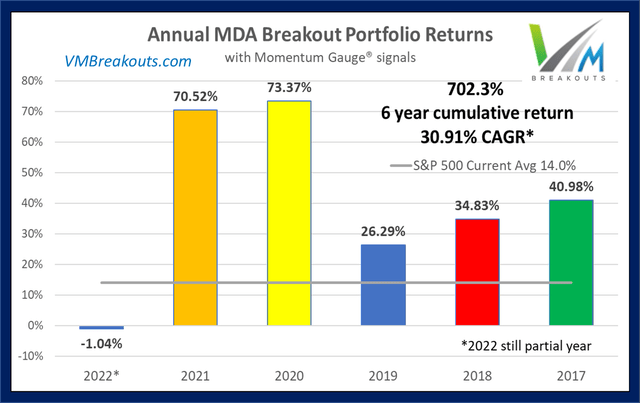
Market Momentum Conditions
Why not avoid all the major market downturns? It is best to follow the signals as the Federal Reserves’ Quantitative Tightening program is scheduled to begin in June: How Markets May React To Fed’s QT Program
The Market Momentum Gauges® based on 7,500+ stocks continue negative this week at Negative 114 and Positive 9. The negative value continues above 40 warning level of adverse market conditions through 2022.
app.VMBreakouts.com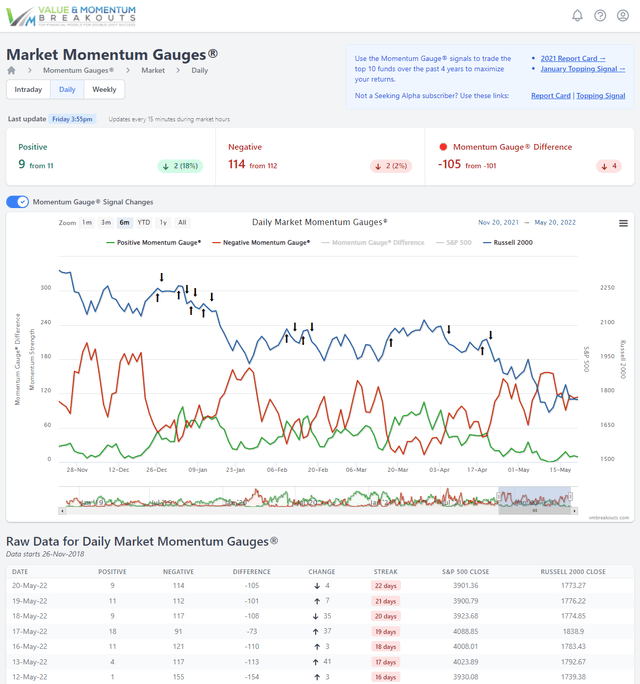
The S&P 500 gauges continue negative closing at Negative 36 and Positive 8. The S&P 500 has been the most resilient of the major indices but continues down -18.14% YTD in the worst start to the year since 1939 and the longest losing streak in 99 years.
app.VMBreakouts.com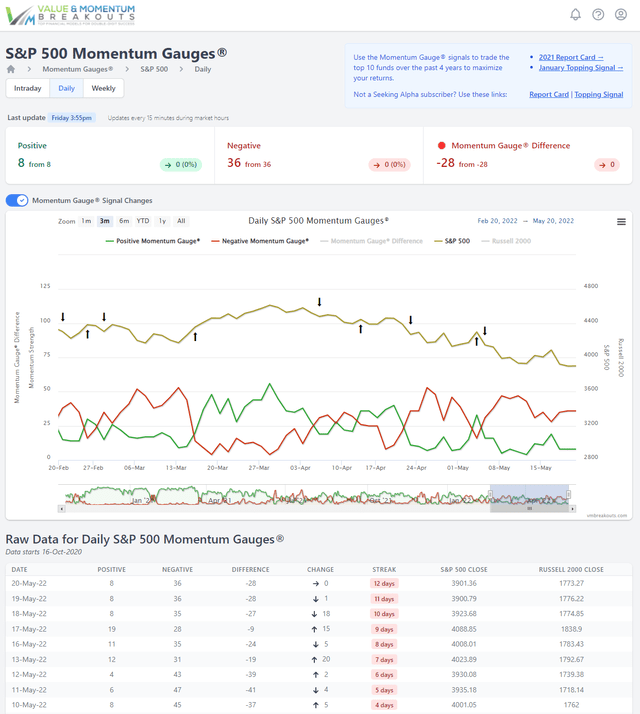
The Weekly Momentum Gauges® continue negative for 7 consecutive weeks with only three weeks positive in the past 26 weeks since November avoiding record market declines. The 2-year weekly chart below includes the 2020 Covid Correction.
app.VMBreakouts.com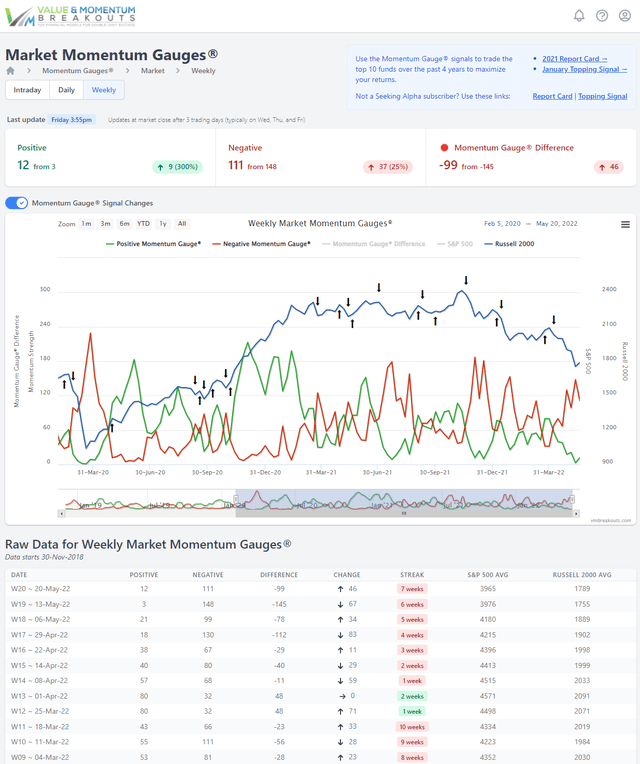
Two conditional signals that are very important to watch:
- Avoid/Minimize trading when the Negative score is higher than the Positive momentum score.
- Avoid/Minimize trading when the Negative score is above 40 on the gauge.
VMBreakouts.com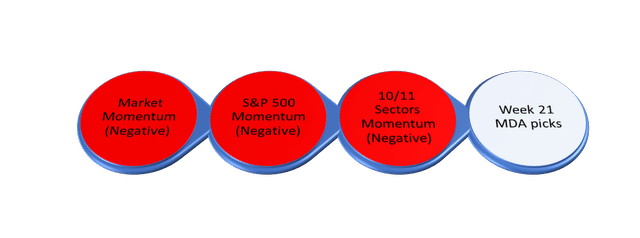
The Week 21 – 2022 Breakout Stocks For Next Week Are:
The picks for next week consist of 2 Healthcare, 1 Consumer Defensive, and 1 Communication Services sector stocks. These stocks were released over the weekend on my return from vacation. Prior selections may be doing well, but for research purposes I deliberately do not duplicate selections from the prior week. These selections are based on MDA characteristics from my research, including strong money flows, positive sentiment, and strong fundamentals — but readers are cautioned to follow the Momentum Gauges® for the best results.
- Mirum Pharma (MIRM) – Healthcare / Biotechnology
- Ooma Inc. (OOMA) – Communication Services / Telecom Services
Mirum Pharma – Healthcare / Biotechnology
FinViz.com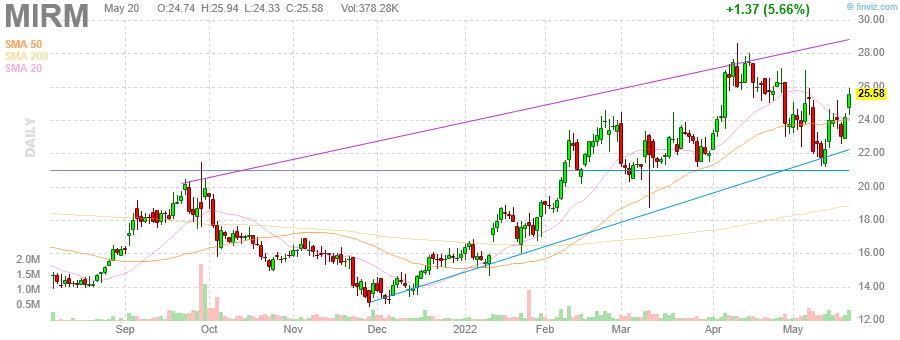
Price Target: $32.00/share (See my FAQ #20 on price targets)
(Source: FinViz)
Mirum Pharmaceuticals, Inc., a biopharmaceutical company, focuses on the development and commercialization of a late-stage pipeline of novel therapies for debilitating liver diseases. The company’s lead product candidate is Maralixibat, an investigational oral drug that is in Phase 3 clinical trial for the treatment of progressive familial intrahepatic cholestasis disease, as well as for the treatment of Alagille syndrome and biliary atresia disease.
Source: Company resources
StockRover.com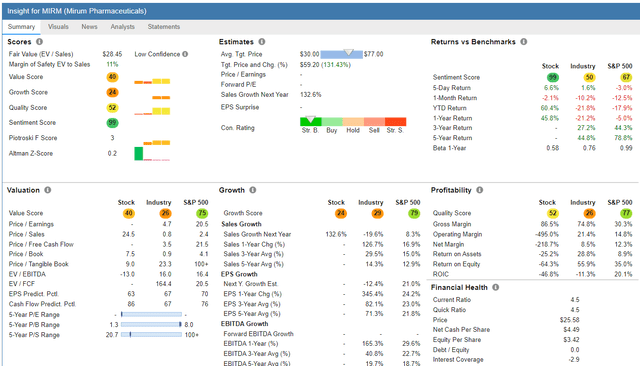
Ooma Inc. – Communication Services / Telecom Services
FinViz.com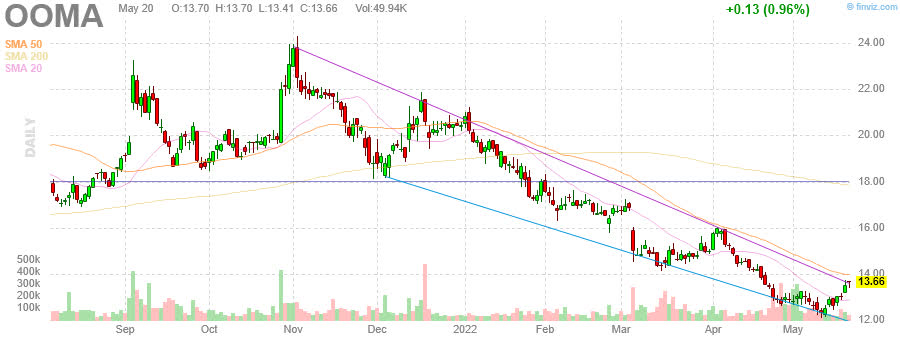
Price Target: $16.00/share (See my FAQ #20 on price targets)
(Source: FinViz)
Ooma, Inc. creates connected experiences for businesses and consumers in the United States, Canada, and internationally. The company’s smart software-as-a-service and unified-communications-as-a-service (UCaaS) platforms serve as a communications hub, which offers cloud-based communications solutions, smart security, and other connected services. Its business and residential solutions deliver PureVoice high-definition voice quality, advanced functionality, and integration with mobile devices; and platform helps to create smart workplace and homes by offering communications, monitoring, security, automation, productivity, and networking infrastructure applications.
Source: Company resources
FinViz.com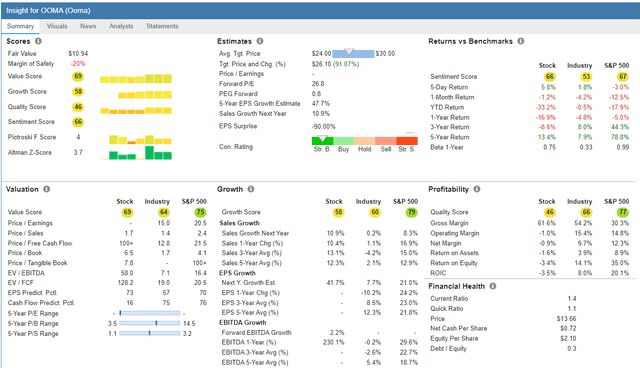
Top Dow 30 Stocks To Watch For Week 21
First, be sure to follow the Momentum Gauges® when applying the same MDA breakout model parameters to only 30 stocks on the Dow Index. Second, these selections are made without regard to market cap or the below-average volatility typical of mega-cap stocks that may produce good results relative to other Dow 30 stocks.
While I don’t expect Dow stocks to outperform typical breakout stocks over the measured five-day breakout period, it may provide some strong additional basis for investors to judge future momentum performance for mega-cap stocks in the short- to medium-term. The most recent picks of weekly Dow selections in pairs for the last 5 weeks:
| Symbol | Company | Current % return from selection Week |
| (MCD) | McDonald’s Corp | -0.64% |
| MRK | Merck & Co. | +4.12% |
| (CVX) | Chevron Corp. | +0.54% |
| MRK | Merck & Co. | +6.36% |
| (AAPL) | Apple Inc. | -12.72% |
| (MRK) | Merck & Co. | +5.48% |
| (WMT) | Walmart | -24.06% |
| DOW | Dow Inc. | -0.57% |
| (DOW) | Dow Inc. | +5.19% |
| (CAT) | Caterpillar | -10.67% |
If you are looking for a much broader selection of mega-cap breakout stocks beyond just 30 Dow stocks with more detailed analysis and strong returns, I would recommend the Growth & Dividend MDA Breakout picks.
These selections are significantly outperforming major hedge funds and all the hedge fund averages since inception. Consider the actively managed ARK Innovation fund down -55.16% YTD and more hedge funds liquidating in 2022.
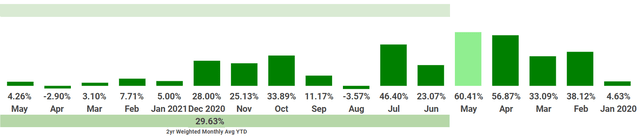
These picks are released monthly for long term total return with strong returns that are leading the S&P 500 by +14.34% through 2022. As members know all the portfolios are substantially improved by following the Momentum Gauges® signal. The March/May selections are heavy in energy and leading the S&P 500 by more the 23% while the April picks are heavy in undervalued financial stocks that have not held up well in this market so far. All the major market indices remain negative YTD and the 2-year returns of monthly portfolios are shown below – not including returns from large dividends over +2% for each stock:
VMBreakouts.com VMBreakouts.com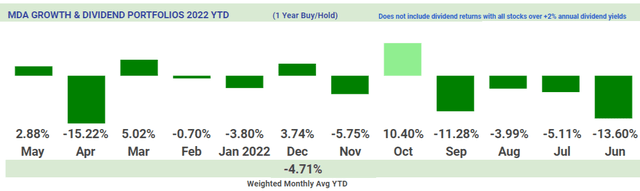
The Dow Picks For Next Week Are:
Amgen Inc. (AMGN)
Amgen is making strong positive technical moves with price in the positive channel from December despite strong market selling. Institutions are net buyers and insiders are only slight net sellers while analysts maintain a $250/share consensus target. Sentiment indicators and money flow indicators are very positive and price could retest the top of the channel around $260/share.
FinViz.com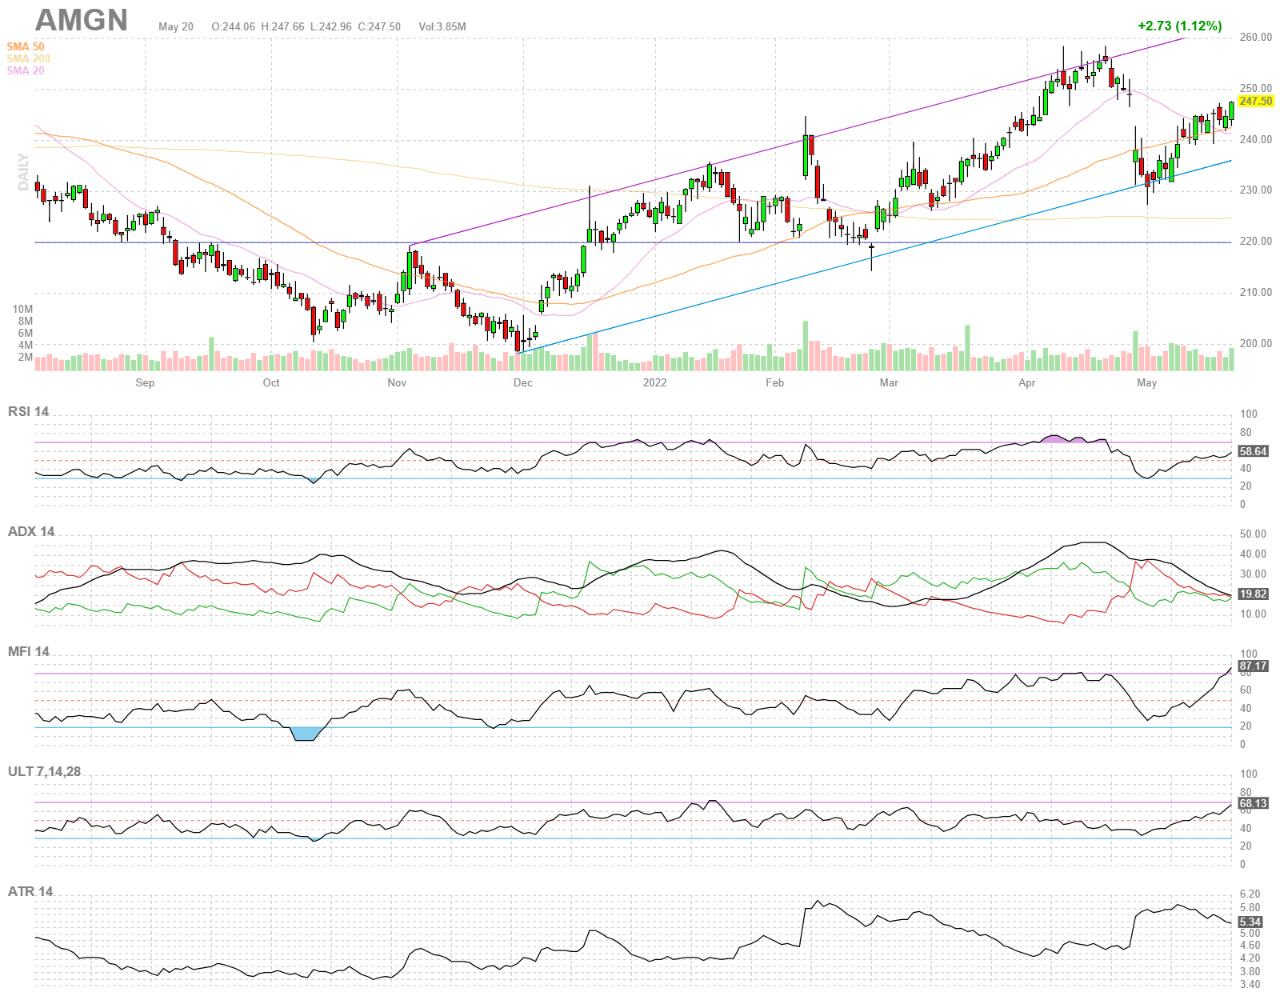
Background On Momentum Breakout Stocks
As I have documented before from my research over the years, these MDA breakout picks were designed as high frequency gainers.
These documented high frequency gains in less than a week continue into 2020 at rates more than four times higher than the average stock market returns against comparable stocks with a minimum $2/share and $100 million market cap. The enhanced gains from further MDA research in 2020 are both larger and more frequent than in previous years in every category. ~ The 2020 MDA Breakout Report Card
The frequency percentages remain very similar to returns documented here on Seeking Alpha since 2017 and at rates that greatly exceed the gains of market returns by 2x and as much as 5x in the case of 5% gains.
VMBreakouts.com
The 2021 and 2020 breakout percentages with 4 stocks selected each week.
VMBreakouts.com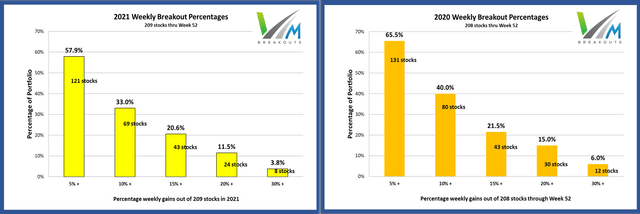
MDA selections are restricted to stocks above $2/share, $100M market cap, and greater than 100k avg daily volume. Penny stocks well below these minimum levels have been shown to benefit greatly from the model but introduce much more risk and may be distorted by inflows from readers selecting the same micro-cap stocks.
Conclusion
These stocks continue the live forward-testing of the breakout selection algorithms from my doctoral research with continuous enhancements over prior years. These Weekly Breakout picks consist of the shortest duration picks of seven quantitative models I publish from top financial research that also include one-year buy/hold value stocks. Remember to follow the Momentum Gauges® in your investing decisions for the best results.
All the V&M portfolio models are still beating the market indices in the worst start to the US stock market since 1939. The new active ETF portfolio is up +25.18% YTD beating the S&P 500 by over 43.3% YTD. The value portfolios of Piotroski-Graham picks are up +5.0% through one of the worst starts in stock market history. The Top ETF returns following the Momentum Gauge® trading signal just from the April 21 negative daily signal are as high +58.1%.
VMBreakouts.com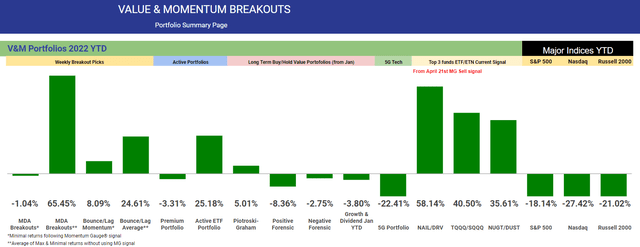
The final 2021 returns for the different portfolio models from January of last year are shown below.
VMBreakouts.com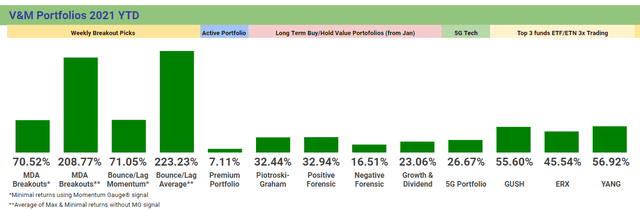
All the very best to you, stay safe and healthy and have a great week of trading!
JD Henning, PhD, MBA, CFE, CAMS


